Building a GTFS Editor: From Concept to Production
A comprehensive walkthrough of creating a professional GTFS (General Transit Feed Specification) editor with modern web technologies
Reading Mode
You are reading this as a blog post. Navigate sections using the table of contents or switch to an interactive slide deck experience.
The Spark of Inspiration
It all started with a simple observation of how data can make a city's heartbeat visible.
I stumbled upon busrouter.sg, a beautifully crafted tool that visualizes Singapore's bus network. But what truly blew my mind was the visualization created by @cheeaun.
Watching those dots move across the screen wasn't just looking at data; it was looking at the life of a city. I knew I wanted to build something like this for Indonesia.
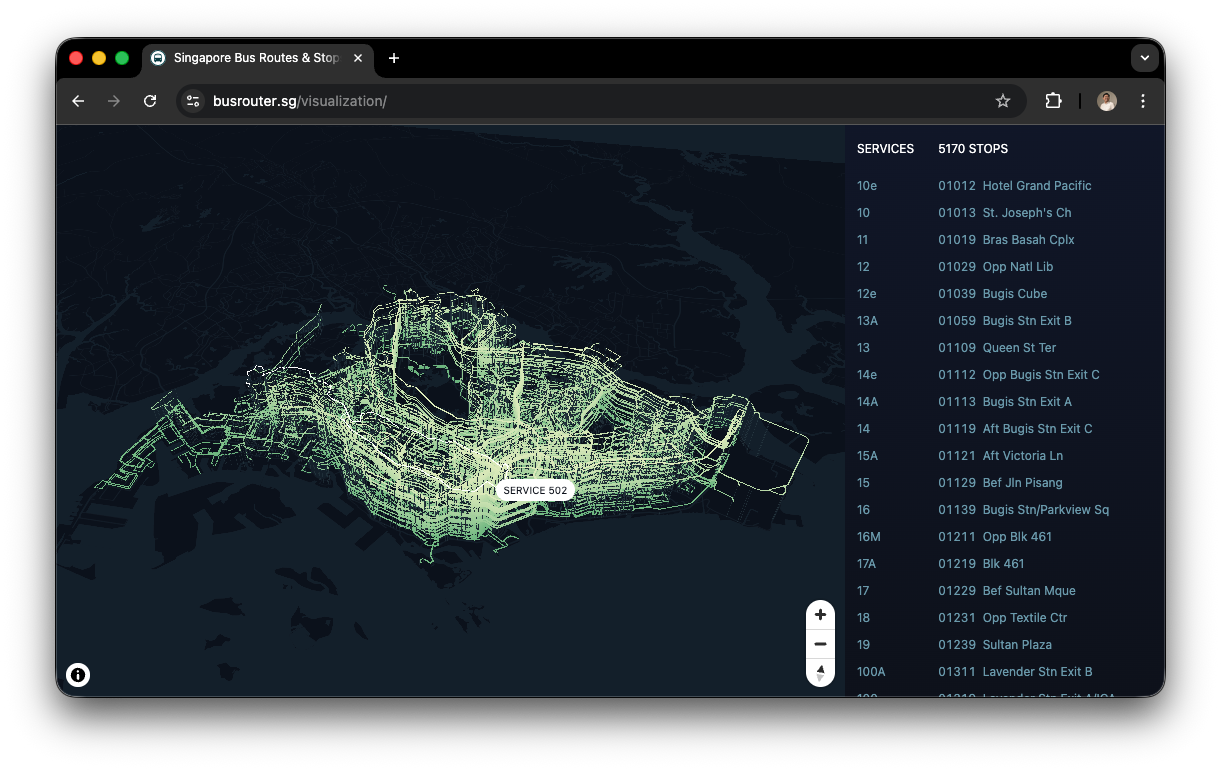
"How do we turn raw transit numbers into a living, breathing map?" — That was the question that started it all.
The Search for a Standard
The ambition was there, but the data was a mystery. How do you define a "route"? How do you synchronize thousands of stops?
I quickly realized that to build a real-world tool, I couldn't just "invent" a format. I needed a standard. That's when I discovered GTFS (General Transit Feed Specification).
Why GTFS?
- Global Standard: Adopted by Google Maps and thousands of agencies.
- Interoperable: If it works for TransJakarta, it works for the world.
- Human-Readable: It’s just a collection of specialized CSV files.
Finding the Data
The "Aha!" moment came when I found out that TransJakarta actually provides public GTFS data.
The data was there, but it was raw. To make it useful—to edit it, fix errors, or optimize routes—I needed more than a text editor. I needed a Visual GTFS Editor.
TransJakarta’s open data became the perfect playground for testing my logic in a high-density urban environment.
The Tech Stack
To build a scalable, multi-tenant editor, I chose a robust modern stack:
- Frontend: Vite + React 19 + Tailwind CSS
- Backend: Node.js (Express) + Prisma
- Database: PostgreSQL
- Maps: Leaflet + React-Leaflet
This architecture allows us to handle heavy data processing on the server while keeping the client interface snappy and responsive.
Phase 1: The Ingestion Challenge
Handling GTFS files isn't simple. These act as massive ZIP archives containing multiple interrelated CSVs (routes.txt, stops.txt, stop_times.txt), often reaching hundreds of megabytes.
The Memory Bottleneck
Loading a 500MB file into memory crashes Node.js immediately. We needed a way to process this data without loading it all at once.
Phase 1: Streaming Solution
We implemented a Stream-based Processing Pipeline using csv-parser and unzipper.
Why this stack?
unzipper: Reads directly from the compressed archive. We don't extract files to disk, saving I/O and storage.csv-parser: Parses lines one by one as they stream in from the unzipper.
Result: We process 500MB+ files with O(1) memory usage, never holding more than a single row in RAM.
// gtfs-be/src/services/gtfs/import.service.js

fs.createReadStream(zipPath)
  .pipe(unzipper.Parse())
  .on('entry', async (entry) => {
     if (entry.path === 'stop_times.txt') {
       // We process stop_times row-by-row as they arrive
       // drastically reducing memory footprint
       entry.pipe(csv()).on('data', row => queueBatchInsert(row))
     } else {
       entry.autodrain()
     }
  })
This allows us to ingest massive feeds like TransJakarta's in seconds without spiking RAM usage.
Phase 2: The Data Core & Multi-Tenancy
A professional editor must support multiple projects. We designed a Multi-Tenant Schema where every record is scoped to a project_id.
This ensures that User A's changes to "Corridor 1" never conflict with User B's version of the same route.
Phase 3: Bringing it to Life
Static lines are boring. I wanted to see the flow.
I built a custom Leaflet Plugin L.Polyline.SnakeAnim.js. This isn't just a simple CSS visual; it involves complex geographic mathematics to ensure realism.
The Challenge: Constant Geographic Speed
Standard animations move at a constant pixel speed. But on a map, 100 pixels at zoom level 10 covers much more distance than at zoom 18.
My implementation calculates the Haversine distance between every vertex to ensure buses move at a realistic speed (e.g., 40km/h) regardless of the map's zoom level.
// utils/leaflet/L.Polyline.SnakeAnim.js

_snake: function () {
  const now = performance.now()
  const diff = now - this._snakingTime

  // Calculate exactly how many METERS to travel based on real-world speed
  // Not pixels!
  const metersToTravel = (diff / 1000) * this.options.speed

  this._snakeForward(metersToTravel)
}
This creates a mesmerizing, geographically accurate visualization of transit flow that remains consistent even as you zoom in and out.
The Editor Site
Moving from theory to practice, I've hosted the editor so you can experience it firsthand.
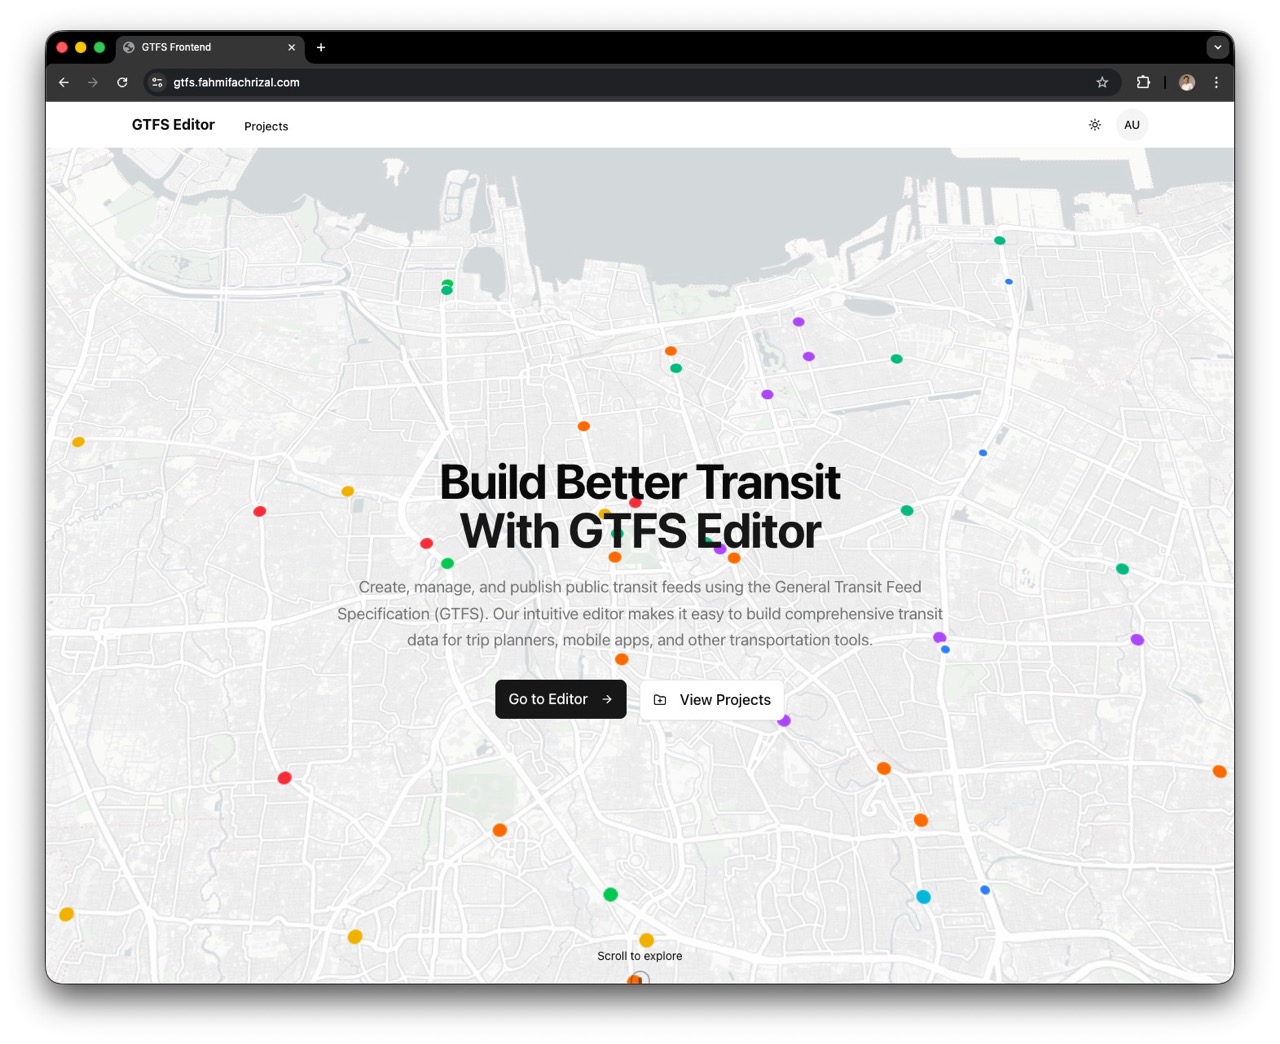
Getting Started
You can jump right in and start exploring standard-compliant GTFS feeds.
- Login: Use the demo credentials to access the admin features.
- Username:
admin - Password:
Password123!
- Username:
- Projects: On the dashboard, you can Add a New Project or simply open an existing one to see the data in action.
Stops 🚏
The fundamental unit of transit. Single points on a map defined by latitude and longitude. They are the digital anchors of the physical system.
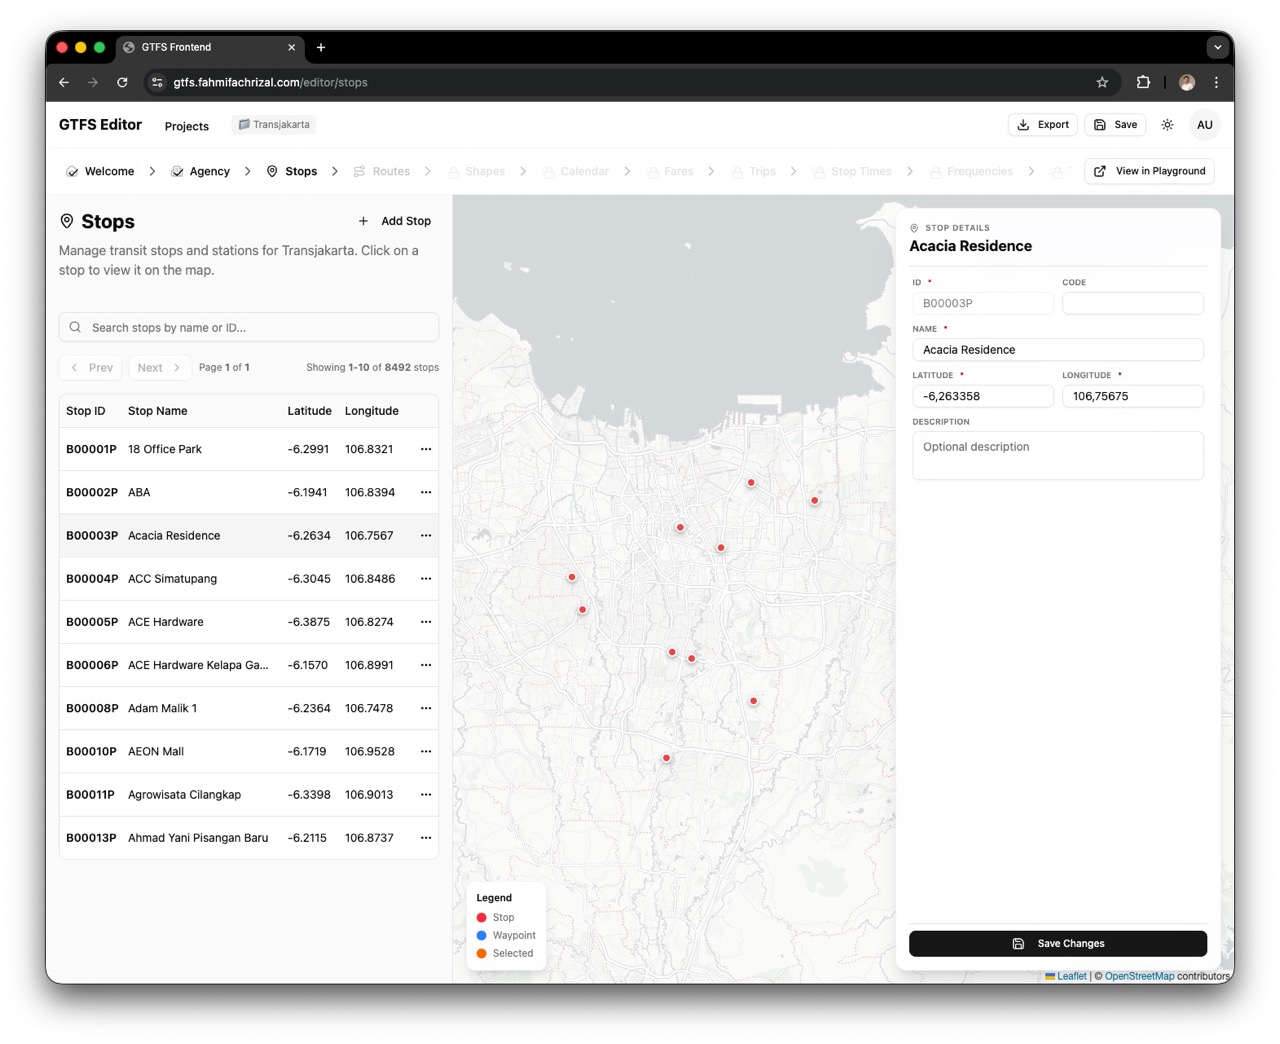
Project → findMany Stops (ordered by stop_name)
Routes & Shapes 🚌
A Route is the logical sequence of stops, while the Shape is the physical path.
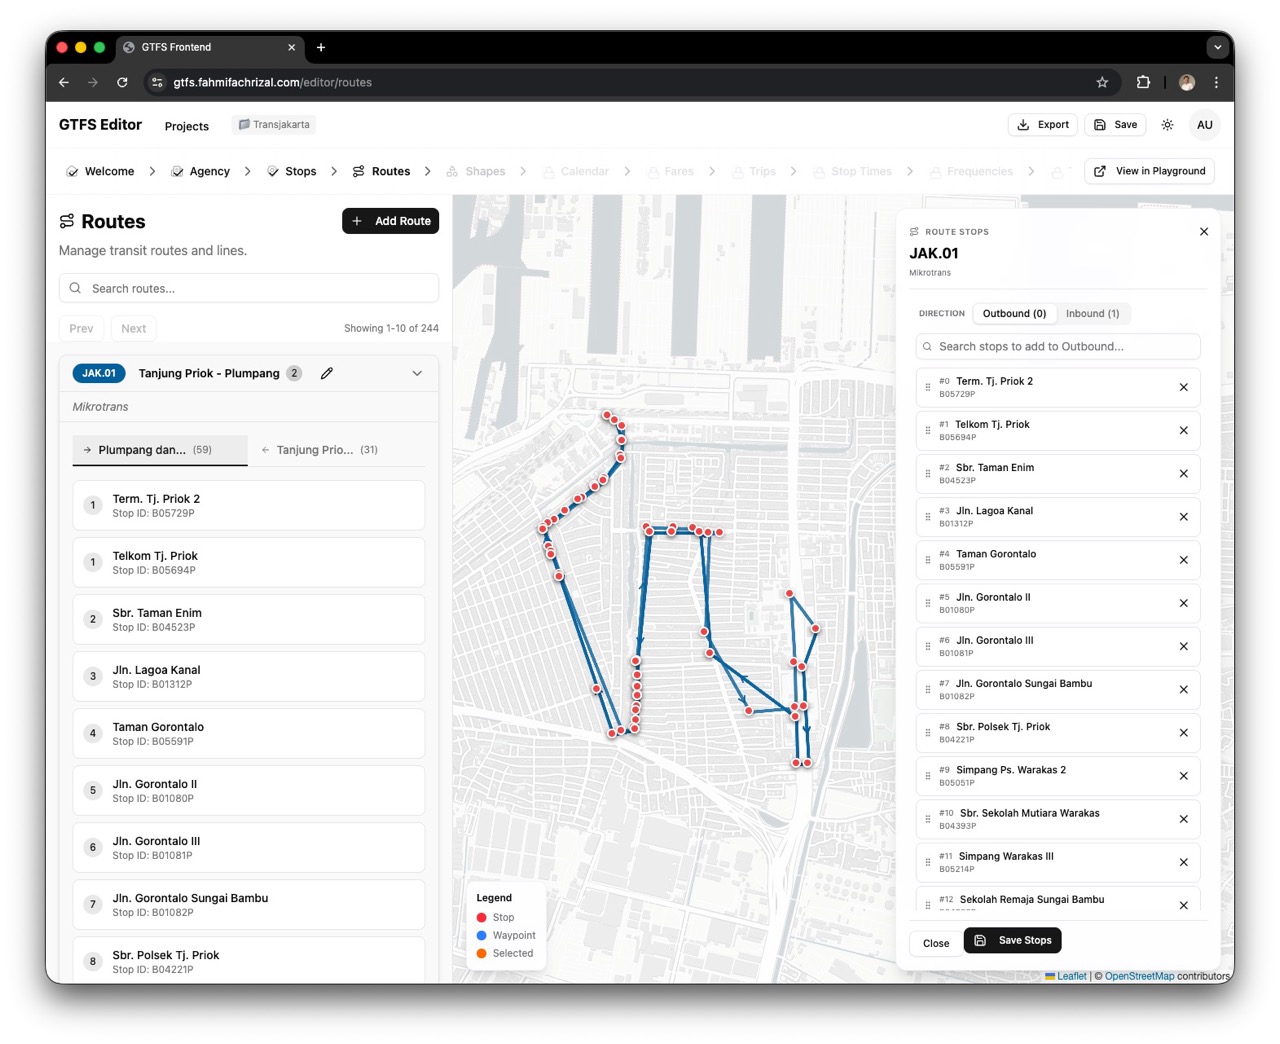 Defining the Logical Route
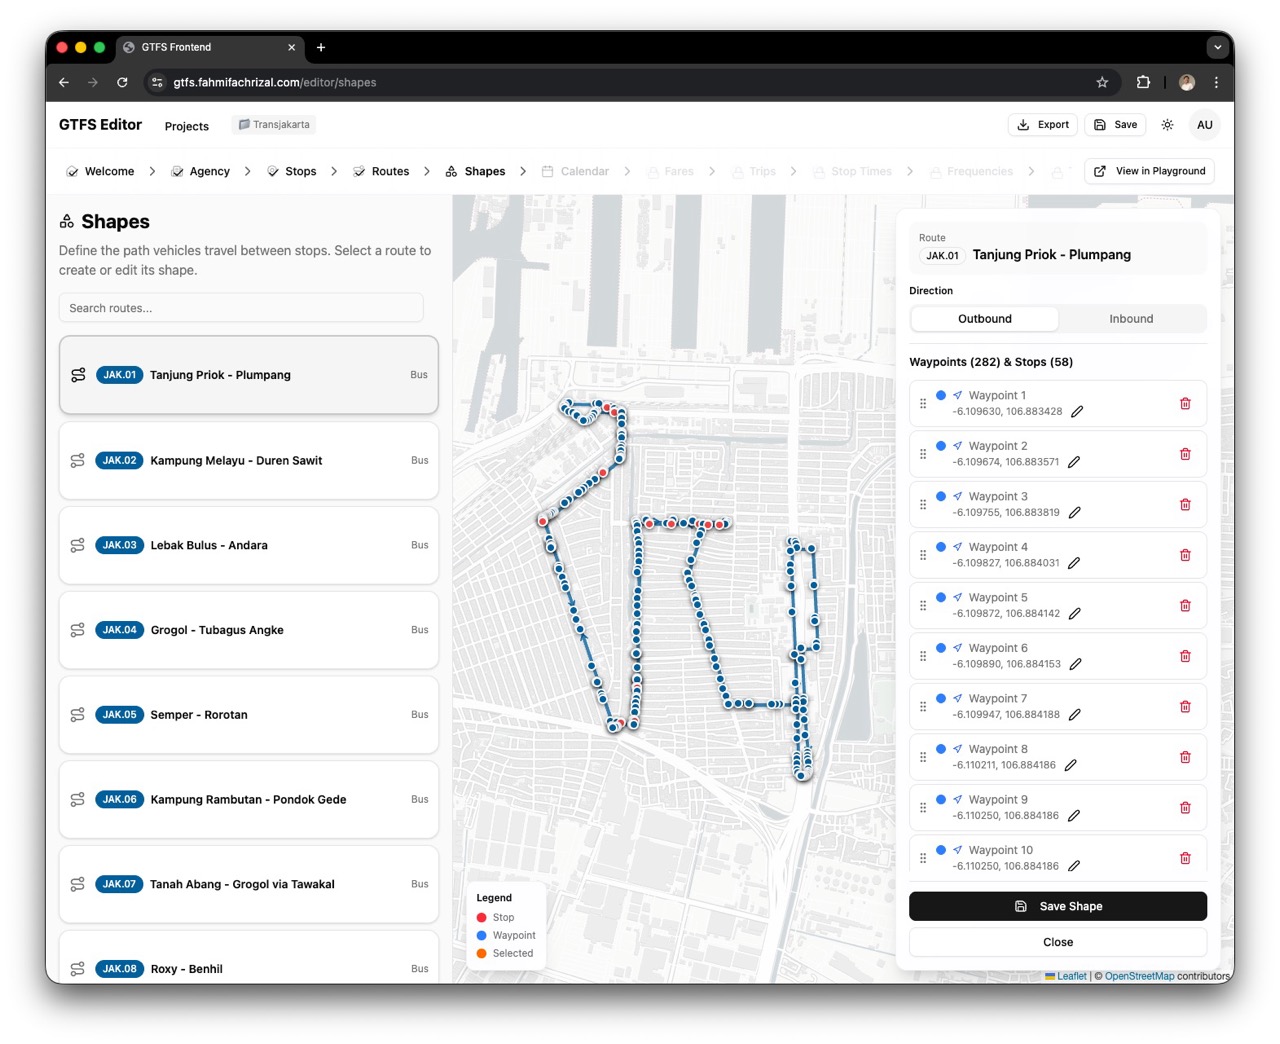 Refining the Physical Shape
Route → findUnique Route
↳ findFirst Trip (shape_id)
↳ findMany Shape (ordered by sequence)
↳ findMany StopTime include Stop
Trips: Adding Time to Space
When you combine a Route (Stops) and a Shape (Path), you get a Functional Route Data (Stops + Order + Path).
But it's static. To make it a Trip, we need to add Time.
The Complexity
Creating trips manually is incredibly difficult. For a 30-stop route, you need 60 distinct timestamps per trip.
Visualizing Trips
We built a specialized UI to handle this complexity without spreadsheets.
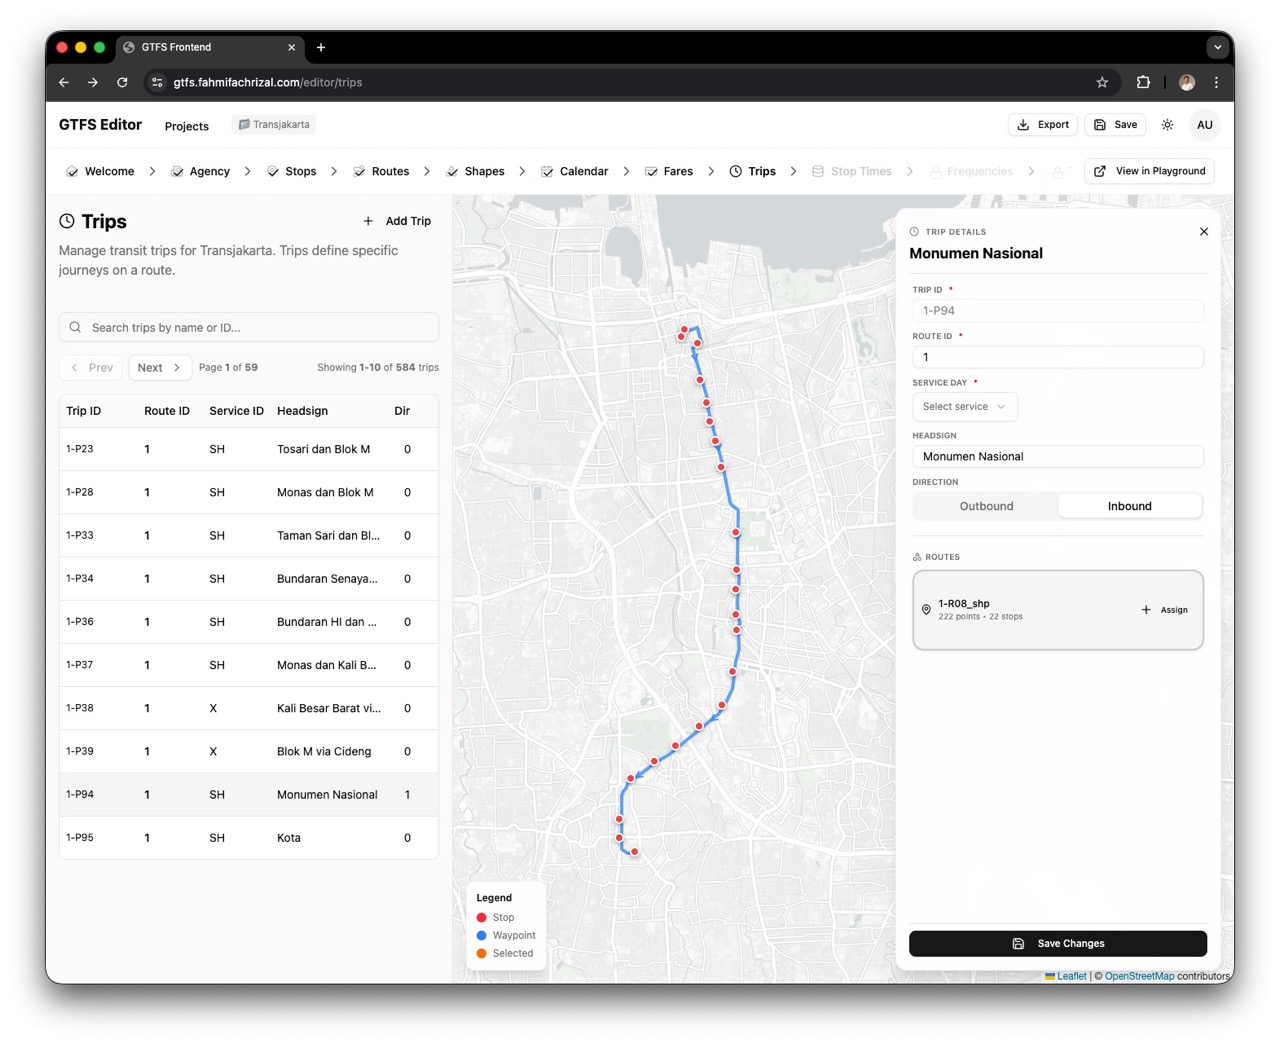
Visualizing the temporal dimension on top of the spatial route.
Schedules & Fares
Operational rules: Calendar (Availability) & Fares (Pricing).
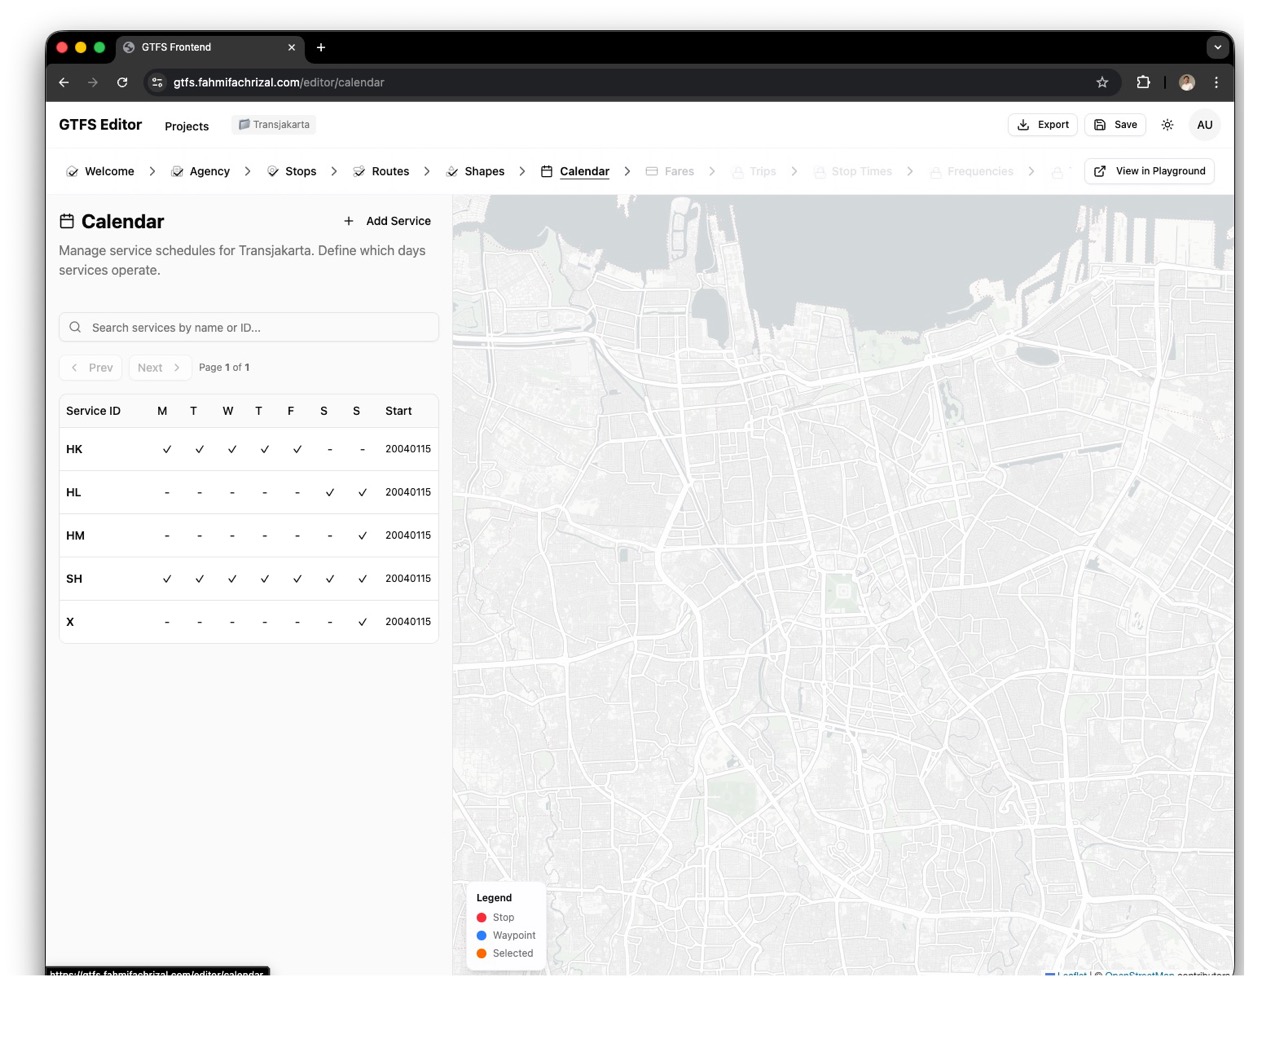
Project → findMany Calendar
Project → findMany FareAttributes
Future Development: Completing the Standard
To make this a true production-grade editor, we plan to implement the remaining complex parts of GTFS:
- Stop Times: The granular schedule for every vehicle at every stop.
- Frequencies: For high-density transit where "every 5 minutes" matters more than "10:02 AM".
- Transfers: Defining valid connection points and walking times between routes.
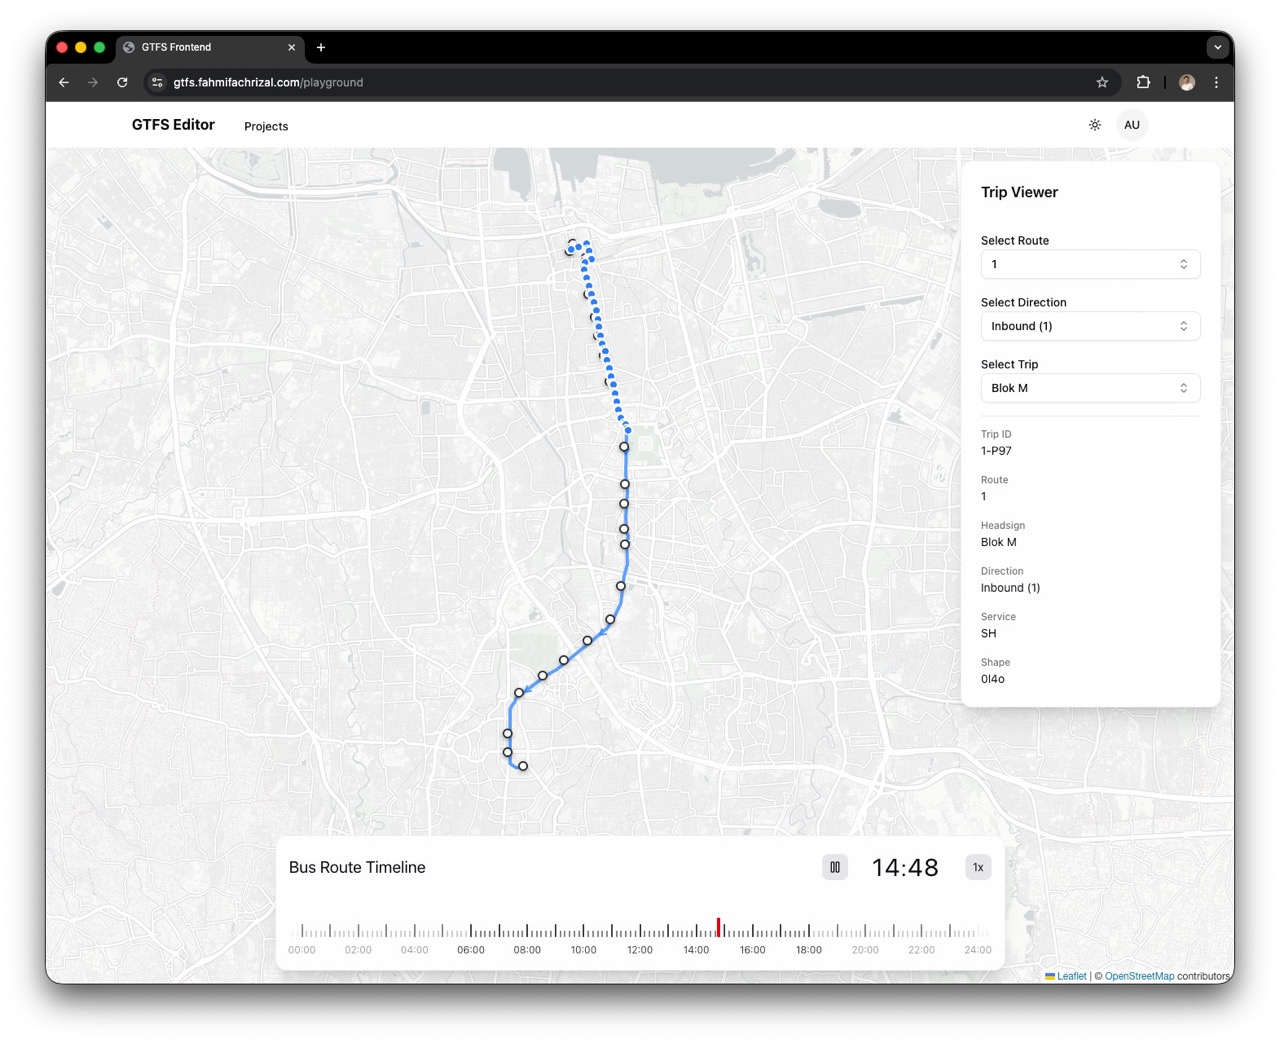
The Playground
Right now, the editor is a Exploration Playground—a place to see the data come to life and verify its correctness visually.
Future: Intelligence Platform
But the vision goes further. I plan to integrate static data sources, such as TransJakarta operational reports.
Imagine overlaying real-world metrics onto our visual map:
- 📊 Passenger Counts: Visualizing volume per stop.
- 👥 Crowdedness: Heatmaps of the most congested stations.
- ⚡ Route Analytics: Calculating the fastest paths.
This transforms the tool from a simple editor into a powerful transit intelligence platform.
Project Facts: By The Numbers
Backend (gtfs-be) 🛠️
Express 5 · PostgreSQL · Prisma 7 · JWT
Key Models: Agency, Stop, Route, Trip, StopTime, Calendar, Shape...
Frontend (Web) 💻
React 19 · Vite · Tailwind 4 · Shadcn
Includes 11 editor sub-pages (Stops, Routes, Calendar, etc.)
Beyond Code: The Value of Contribution
Building this wasn't just about React or PostgreSQL. It was a crash course in server management, memory optimization, and deployment strategy.
I learned that code doesn't exist in a vacuum. The real joy comes from realizing that these lines of JavaScript could one day help a commuter save 10 minutes of their day.
This is just the start. I'm deeply interested in contributing to open data initiatives that drive tangible social change.
Here's to building technology that matters. 🌍🚀